Quick Stacked Area Time Series Plot
qstacktseries.RdQuick Stacked Area Time Series Plot
qstacktseries(
  data,
  time,
  voi,
  group,
  round_values = FALSE,
  verbose = FALSE,
  default_theme = TRUE
)
Arguments
| data | A data frame or tibble where the inputs time, voi and group are stored. |
|---|---|
| time | A numeric vector that represents time (year, month, day), stored in the data set data. |
| voi | A continuous, numeric vector stored in the data set data (this is your variable of interest that might have interesting variations over time). |
| group | A character or factor vector that is used to group the numeric data, voi, in the specified data set, data. |
| round_values | An optional argument that rounds the variable of interest (voi) to 3 digits (default = FALSE). |
| verbose | An optional argument that that keeps the user up-to-date with the ongoing processes at each step of the graphing function (default = FALSE). |
| default_theme | An optional argument that specifies a default theme: uses theme_minimal with bold plot title, legend title, and axis titles (default = TRUE). |
Value
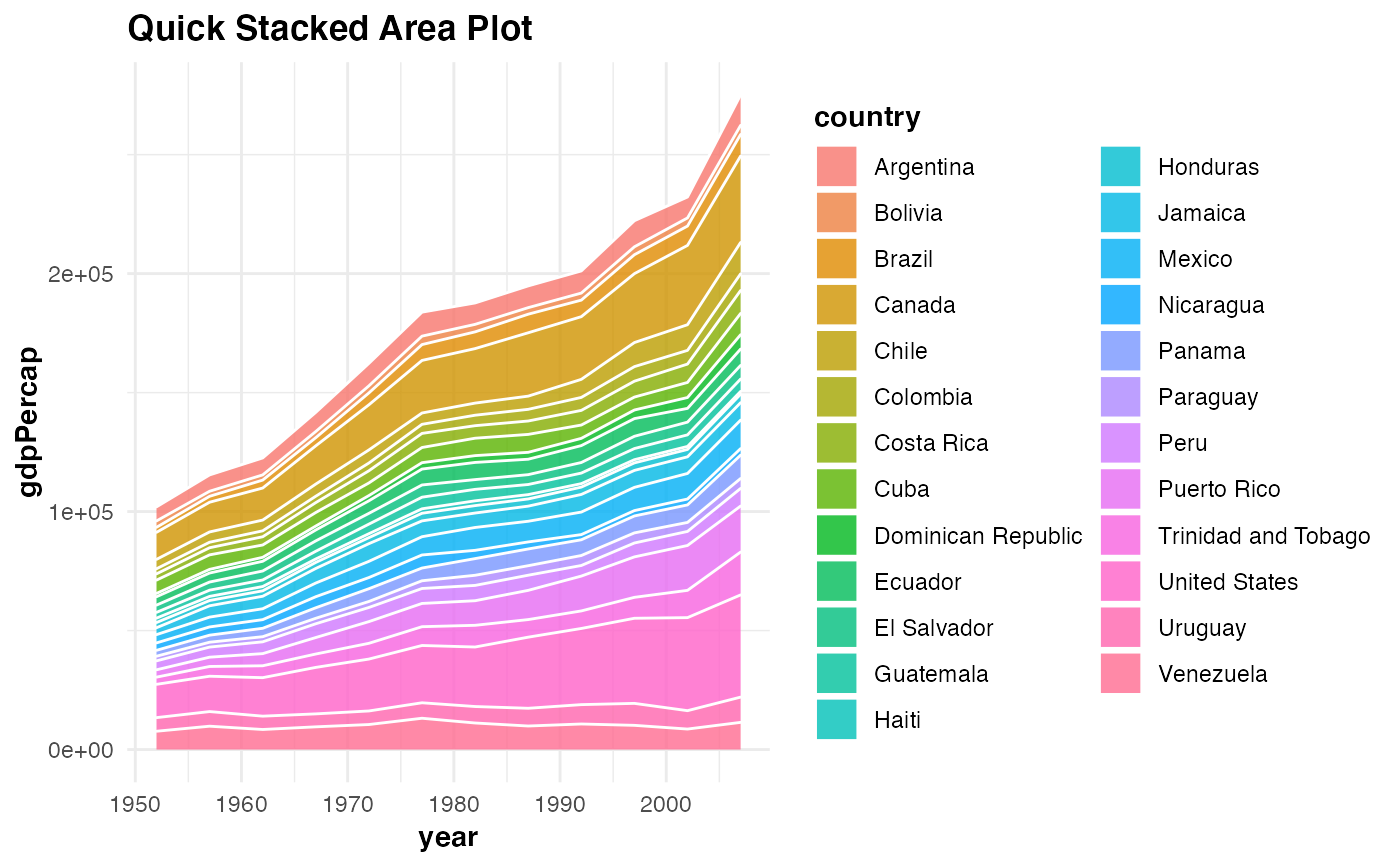
A ggplot object (a stacked area plot) depicting the temporal dynamics of some variable (voi) grouped by a factor variable (group) from the specified data set (data).
Examples
#> Plotting time series...Done labelling plot!...Done applying default theme aesthetics!qstacktseries(gapminder::gapminder %>% dplyr::filter(continent == "Americas"), year, gdpPercap, country, verbose = TRUE)#> Plotting time series...Done labelling plot!...Done applying default theme aesthetics!

